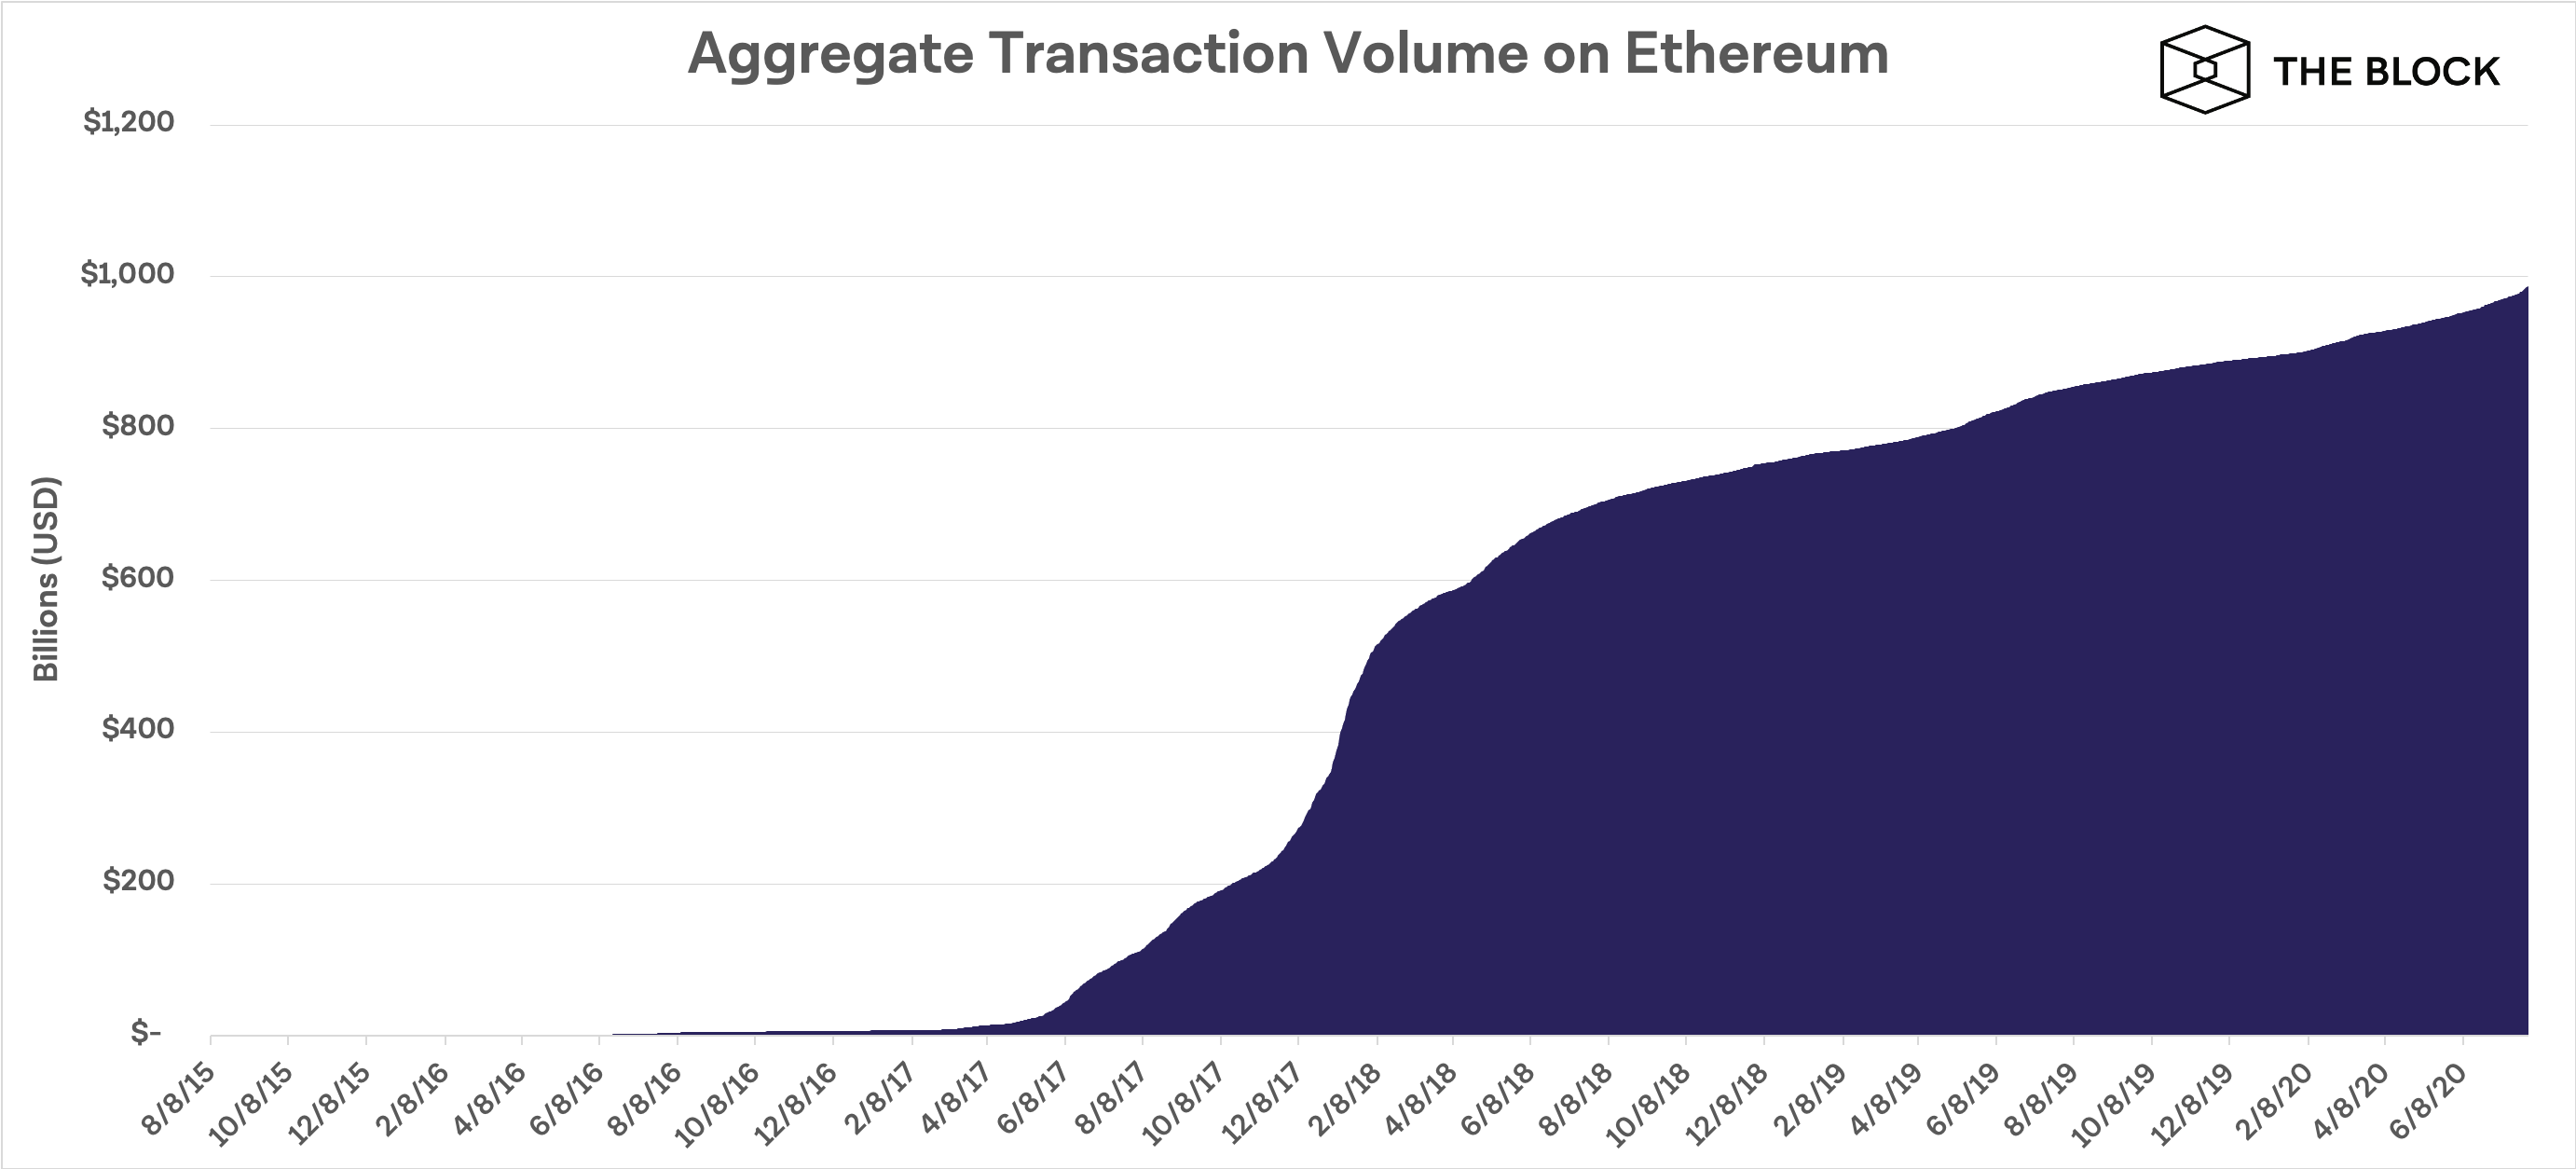
Ethereum's fifth anniversary saw network near $1 trillion in aggregate transaction volume since launch


Ethereum was inching closer toward a network milestone when its fifth birthday arrived: nearly $1 trillion in aggregate transaction volume since July 30, 2015.
As reported in The Block's five-year data breakdown of the network, July 30 saw Ethereum reach roughly $986 billion in aggregate transaction volume. As shown in the chart below, Ethereum saw a significant swell of activity beginning in 2018, with the increase becoming more gradual toward the end of that year.

Source: Coin Metrics
To read the full article on "Charting Ethereum's five-year journey by the numbers," click here.
TAGS


